Pull up South Oceanside's numbers for the three months ending June 2026 and you get two stories that don't agree. The median sale price sits at $1.5 million, down a modest 3.9 percent from the same stretch last year. The median price per square foot sits at $831, down 17.2 percent. A price that barely moved and a price-per-foot metric that fell nearly five times as fast are not describing the same market. They're describing two markets that happen to share a zip code.
Anyone comparing South Oceanside to another coastal North County neighborhood using the median alone is missing the part that actually determines what a specific address is worth: which side of Interstate 5 it sits on, and what kind of house is doing the selling this year versus last.
What "West of the 5" Actually Means on a Deed
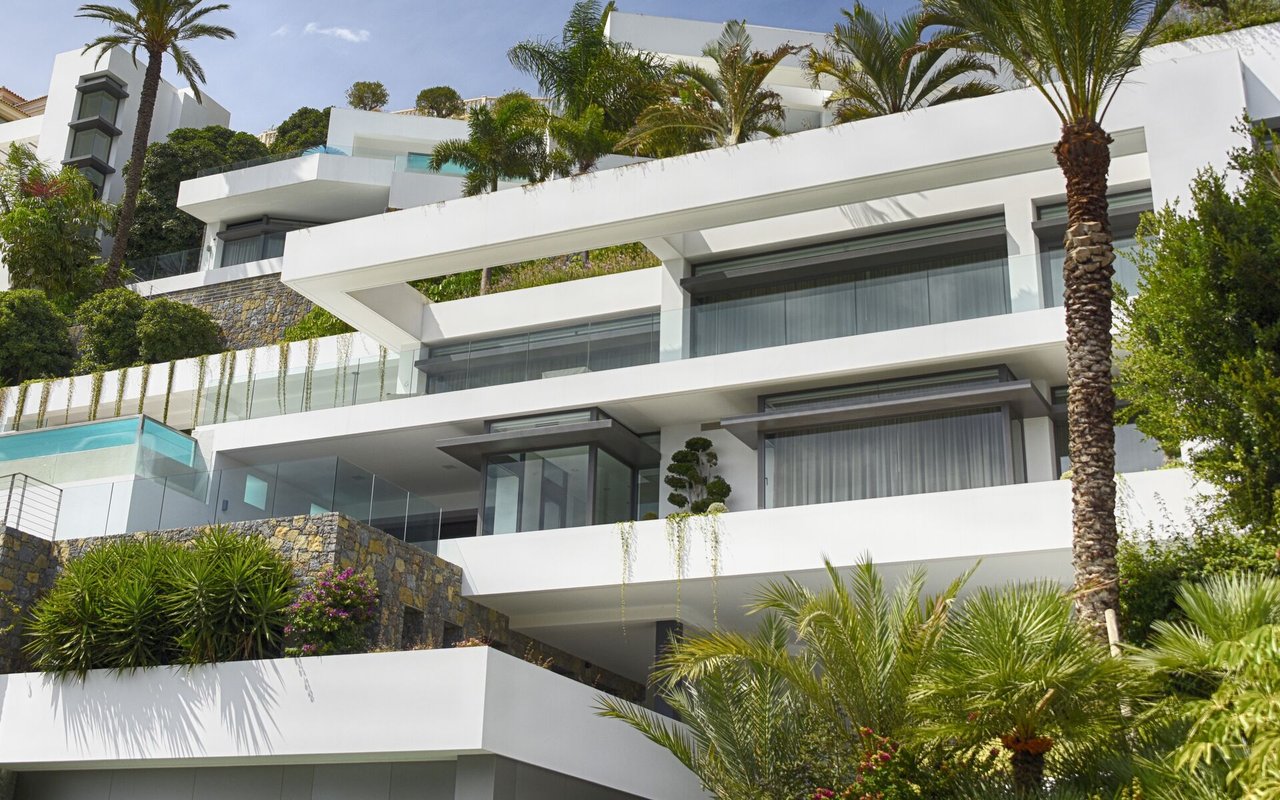
South Oceanside isn't split by a planning boundary or a school attendance line. It's split by a freeway. Interstate 5 runs through the neighborhood, and everything on the ocean side of it gets referred to, consistently and across listings from unrelated brokerages, as "west of the 5." That stretch includes the gated St. Malo community, known for French Normandy and Tudor-style homes, and the Seaside district. It's the part of South Oceanside where a short walk gets you to sand, and where listings routinely advertise direct beach access as the headline feature.
East of that line, and inland from the immediate coastal blocks, is the rest of the neighborhood: a mix that Oceanside's own listing descriptions characterize as single-story homes from the 1960s, condos, townhouses, and custom multimillion-dollar rebuilds sitting on the same streets. That mix matters more than it sounds, because it means the "typical" South Oceanside home isn't one thing. It's an original 1960s ranch on one lot and a gutted, expanded, rebuilt version of the same footprint two doors down, and both get counted in the same median.
The Math Underneath the Median
Here's where the two headline numbers start to make sense together.
If price per square foot fell 17.2 percent over the same three months that total price fell only 3.9 percent, the arithmetic only balances one way: the typical home that actually closed this year is meaningfully bigger than the typical home that closed last year. Run the two percentages against each other and the implied gain in square footage lands somewhere around 16 to 20 percent. That's not a small rounding difference. That's a different house.
That tracks with what's happening on the ground. South Oceanside's east-of-the-5 blocks have long been a target for expansion and teardown-rebuild projects on 1960s lots, and construction pricing in Oceanside currently runs $324 to $432 per square foot for a standard new build, according to a construction feasibility breakdown published in June 2026, with luxury custom work reaching $810 or more per square foot. A resale currently pricing at a median of $831 per square foot is now sitting at or above what it costs to build new construction from the ground up on a standard build. Land in the neighborhood's zip code runs roughly $250,000 to $500,000 for a straightforward lot with minimal improvements, per the same source. That gap between resale price per foot and build cost per foot is exactly the kind of number that changes whether a teardown pencils out better than buying finished.
Put plainly: more of what sold this year came from larger, expanded, or newly built homes east of the 5 and inland, priced at a blended lower rate per square foot, while a much smaller number of small-footprint, high-dollar-per-foot properties west of the 5 kept the median propped up without doing much of the volume.
| Metric | 3 months ending June 2026 | Same period, prior year |
|---|---|---|
| Median sale price | $1.5 million | ~$1.56 million (implied, down 3.9%) |
| Median price per square foot | $831 | ~$1,003 (implied, down 17.2%) |
| Homes sold in June | 21 | 6 |
| Average days on market | 33 | 18 |
Two Speeds Inside One Neighborhood
The volume number is the one that should reframe how the rest gets read. Twenty-one homes sold in June 2026 against six the year before isn't a modest uptick. It's more than triple. At the same time, average days on market roughly doubled, from 18 to 33 days over that same three-month window, and other snapshots of the neighborhood put typical time on market even higher: 48 days in one same-month count of active listings, 63 days for the most recent batch of closings, and 56 days specifically for the handful of homes marketed with a view. Redfin's own competitiveness score puts South Oceanside at 61 out of 100, "somewhat competitive," where a hot listing can still move in about 16 days near asking price, but the average home is settling roughly 2 percent under list after closer to 39 days.
None of that reads as a market freezing up. It reads as a market that's rebalancing: more inventory changing hands, more time for buyers to shop it, and a widening gap between what a hot, well-priced listing does and what an average one does. Meanwhile the shelf of what's actually for sale right now stays thin. One June 2026 snapshot counted only 4 single-family houses actively listed in South Oceanside, ranging from $1,395,000 to $4,675,000, a spread wide enough that a single new listing at either end can swing the sample. Sixteen recently sold listings pulled at the same time showed a median list price of $1.55 million. Small samples like these are exactly why the trailing-twelve-month figures, not a single month's snapshot, are the number worth anchoring to.
The new construction segment tells a slightly different version of the same story. Homes in that category posted a trailing 12-month median sale price of $1,521,500, down 5 percent year over year, but sold in an average of 36 days against a national new-construction average of 52 days. New builds in the neighborhood are still moving faster than the country as a whole even as their price softens, which is consistent with buyers gravitating toward the larger, newer product at a lower rate per foot rather than competing hardest for the smallest, oldest, west-of-the-5 stock.
What This Means If You're Pricing a Specific Address
None of this says South Oceanside is cheaper or more expensive than it was a year ago in any simple sense. It says the median is being generated by two different products this year than it was generating it from last year, and a buyer who only checks the median before making an offer is comparing against a number that may not describe the house in front of them at all.
A property west of the 5, close to St. Malo or the Seaside district, is still trading against the small, scarce, high-dollar-per-foot comp set that's been propping up the median all along. A property east of the line, especially one that's already been expanded or rebuilt, is trading against a much larger, faster-moving pool of comps at a lower blended rate per square foot, even though the total dollars involved can still land in seven figures. The neighborhood's new infill activity, including The Flats, an 18-unit boutique residential and retail project completed in 2024 that added ground-floor retail space along with its units, is more evidence that the east-of-the-5 corridor is still absorbing new density and new construction even while the west-side trophy segment moves slowly.
For anyone weighing a purchase, a remodel, or a full rebuild in South Oceanside, the question isn't whether the median is $1.5 million. It's which side of that median the specific address sits on, and whether the comps being used to price it actually match the house.
Quick Answers
Is "west of the 5" an official boundary? No. It's not a zoning line or an assessor designation. It's shorthand that shows up consistently across independent listings and local agents to describe the ocean-side blocks of South Oceanside, including St. Malo and the Seaside district, as distinct from the rest of the neighborhood.
Does a lower price per square foot mean South Oceanside is getting cheaper? Not by itself. The metric fell 17.2 percent over the three months ending June 2026 while the median sale price fell only 3.9 percent, which points to larger homes moving through the sample rather than a broad discount on every square foot in the neighborhood.
Why did sales volume jump so much while days on market also went up? More listings came to market and more of them closed, but each one is taking longer to find its buyer than it did a year earlier. Those two things can happen at once when a market shifts from a handful of homes selling fast to a wider set of homes selling at a more normal pace.
If you're trying to figure out what a specific South Oceanside address is actually worth, given which side of the 5 it sits on and what shape the comps around it are really in, that's a conversation worth having before you write an offer or a construction budget. OwensCPM works these numbers block by block, not just by zip code median.